Module 3 — LLM Metrics & GPU Monitoring
Every developer on the platform has just used Qwen3.6 — through OpenCode during development and through the Fortune Cookie app at runtime. From the Platform Engineer’s perspective, this LLM consumption is real infrastructure cost. In this module, you look at what happened: how much GPU was used, how the model performed under load, and how you would govern LLM usage at scale.
|
Estimated time: 20 minutes |
Two Monitoring Surfaces
| Dashboard | What It Shows |
|---|---|
NVIDIA DCGM Exporter Dashboard |
Raw GPU hardware metrics: utilization %, VRAM usage, temperature, power draw, PCIe bandwidth. Auto-loaded into the OpenShift monitoring console by the |
OpenShift AI Model Metrics |
LLM-specific metrics: requests/sec, tokens generated per second (throughput), time-to-first-token (TTFT), request latency percentiles, concurrent requests in-flight. |
Part 1: NVIDIA DCGM GPU Dashboard
Open the Dashboard
-
In the OpenShift Web Console, navigate to:
Observe → Dashboards
-
In the Dashboard dropdown, search for
NVIDIA DCGM Exporter Dashboard. -
Select the GPU node from the node filter (it should be the only
g6e.xlargenode).
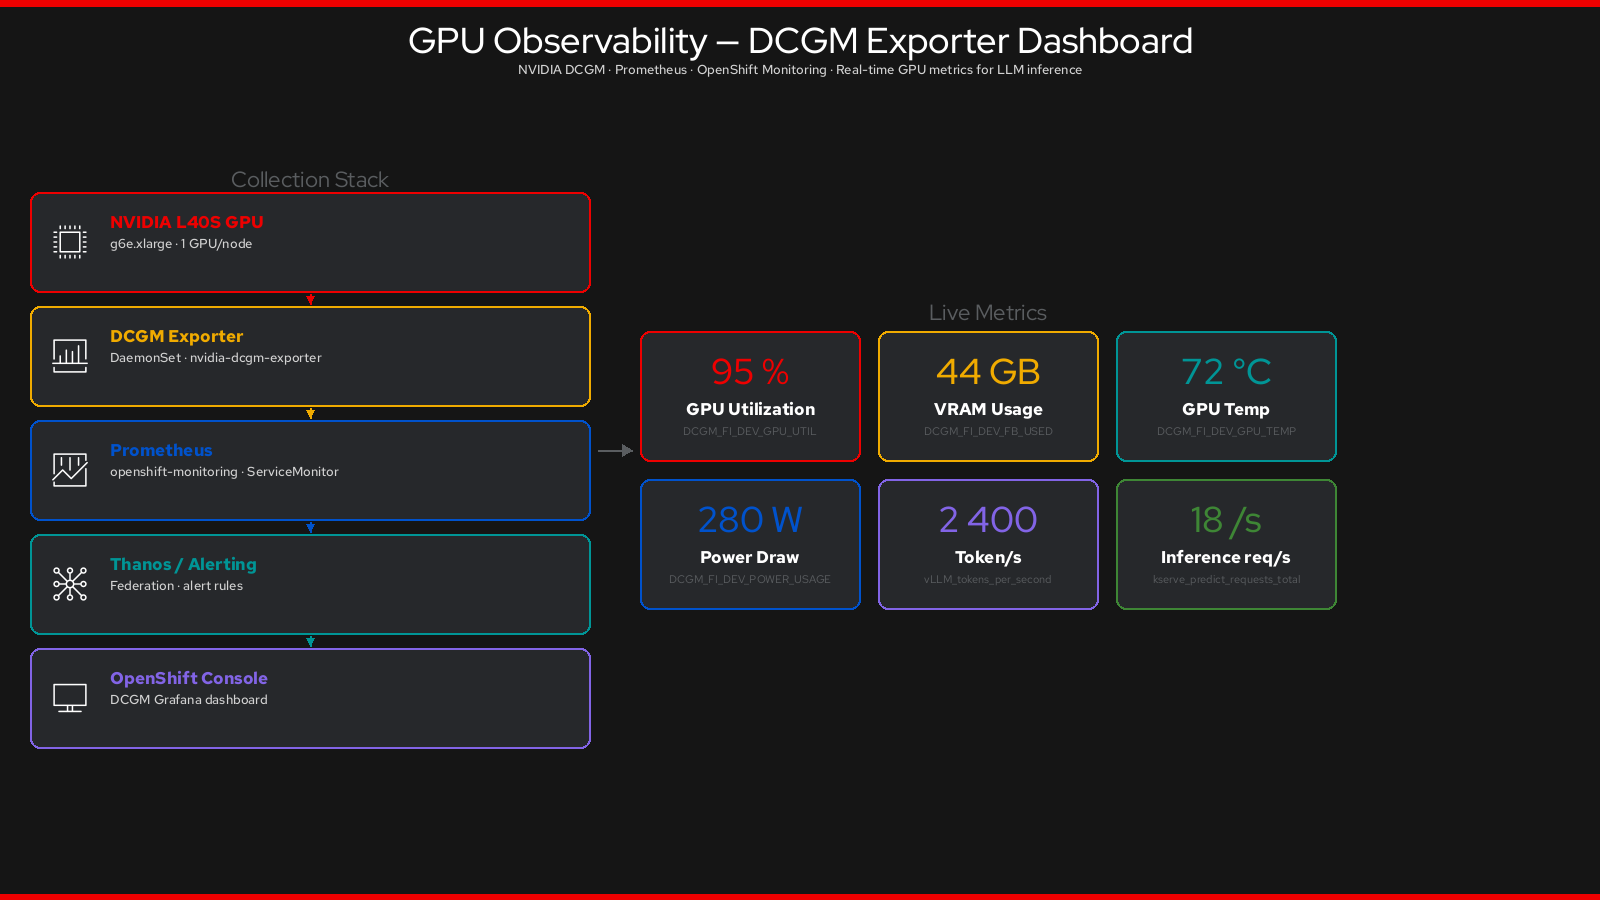
Key Metrics to Review
| Metric | What It Tells You | Healthy Range |
|---|---|---|
GPU Utilization % |
Percentage of time the GPU compute cores are active. High during inference, near 0 when idle. |
30-95% during load |
GPU Memory Used (GiB) |
VRAM consumed by the model weights + KV cache. Qwen3.6 AWQ-4bit uses ~20 GB of the 48 GB L40S. |
~20-40 GiB |
GPU Temperature (°C) |
Thermal state. L40S throttles above 87°C. |
< 80°C |
GPU Power Draw (W) |
Electricity consumption. Correlates directly with inference load. |
50-300 W (idle to full load) |
PCIe RX/TX Bandwidth |
Data transfer between CPU and GPU — relevant for large batch inputs. |
Spikes during model loading |
Correlate with Workshop Activity
Look at the GPU Utilization graph over the last 30 minutes. You should see:
-
Spike at model load time (when the PVC weights were read into VRAM)
-
Activity bursts when participants used OpenCode (each prompt = GPU compute)
-
Sustained utilization from Fortune Cookie app calls
-
Periods of lower utilization between bursts (GPU efficient — not spinning at 100% idle)
|
This is the governance moment. Ask the participants: if you had 50 developers using OpenCode all day, what would this graph look like? At what point would you need a second GPU node? The Platform Engineer can see saturation happening here — and use that data to justify expanding the machine pool. |
Part 2: OpenShift AI Model Metrics
Access the Model Metrics
OpenShift AI exposes KServe’s built-in metrics via the cluster monitoring stack (Prometheus).
-
Navigate to Observe → Metrics in the OpenShift Web Console.
-
In the query field, explore these PromQL expressions:
Inference Request Rate
rate(vllm:request_success_total{namespace="llm-serving"}[5m])Shows requests per second successfully served by vLLM. During the workshop, you should see a baseline from OpenCode usage plus spikes from Fortune Cookie app calls.
Token Generation Throughput
rate(vllm:generation_tokens_total{namespace="llm-serving"}[5m])Tokens generated per second. A 35B model on an L40S typically achieves 20-60 tokens/sec depending on batch size and prompt length.
Time to First Token (TTFT)
histogram_quantile(0.95,
  rate(vllm:time_to_first_token_seconds_bucket{namespace="llm-serving"}[5m])
)
The 95th percentile TTFT — how long users wait before seeing the first word of a response. Should be under 2-3 seconds for interactive use.
Concurrent Requests In-Flight
vllm:num_requests_running{namespace="llm-serving"}Number of requests being processed simultaneously. vLLM’s continuous batching allows multiple requests to run in parallel on the same GPU. This is the key capacity metric — when it saturates, it is time to add a second GPU node.
Part 3: The Governance Story
Cost Attribution
Each Fortune Cookie request consumes GPU-time. A Platform Engineer can estimate costs:
Token throughput:      ~30 tokens/sec
Average fortune:       ~40 tokens
Requests per fortune:  1
Cost per token (L40S): ~$0.00003 (rough estimate: g6e.xlarge ~$1.65/hr ÷ 3600s ÷ 30 tok/s)

Cost per fortune:      ~40 × $0.00003 = $0.0012
At scale: 100 developers each making 100 OpenCode requests/day × 500 tokens average = ~$15/day in GPU compute. This is measurable, predictable, and attributable to teams — something you cannot do with a shared SaaS API key.
Machine Pool Status
Confirm the GPU node is still running and the inference service is healthy:
rosa list machinepools --cluster $CLUSTER_NAMEID AUTOSCALING REPLICAS INSTANCE TYPE TAINTS
gpu No 1 g6e.xlarge nvidia.com/gpu=present:NoScheduleoc get inferenceservice qwen3 -n llm-serving \
-o jsonpath='{.status.components.predictor}'|
This workshop uses a fixed single-node pool. In a production scenario you would use KEDA watching the |
Namespace-Level Usage Visibility
The Platform Engineer can see resource consumption by namespace:
# GPU usage by namespace (who is consuming the GPU?)
oc adm top pod -n llm-serving --use-protocol-buffers 2>/dev/null || \
oc get pod -n llm-serving -o wide
# Developer namespace resource usage
oc adm top pod -n fortune-cookie-dev 2>/dev/null || \
oc get pod -n fortune-cookie-devPart 4: Token-Based Governance with Red Hat Connectivity Link
So far you have watched GPU metrics. But what about token consumption — the unit that actually drives LLM costs? Red Hat provides two complementary mechanisms for this.
TokenRateLimitPolicy (Red Hat Connectivity Link)
Introduced in February 2026, TokenRateLimitPolicy extends the Envoy gateway to enforce per-user or per-team token budgets rather than simple request counts. This is the right unit for LLM billing: a one-sentence prompt costs 20 tokens; a full code review might cost 8,000.
How it works:
-
AuthPolicyvalidates API keys and injects user metadata (team, tier) into the request. -
TokenRateLimitPolicyintercepts the LLM response and extracts theusagefield from the OpenAI-compatible response body. -
Tokens are counted against the user’s daily quota. If the budget is exceeded, subsequent requests receive HTTP 429.
Example policy with two tiers:
apiVersion: kuadrant.io/v1alpha1
kind: TokenRateLimitPolicy
metadata:
  name: llm-token-limits
  namespace: llm-serving
spec:
  targetRef:
    group: gateway.networking.k8s.io
    kind: HTTPRoute
    name: qwen3-route
  limits:
    free-tier:
      rates:
        - limit: 20000
          window: 1d
      when:
        - predicate: "auth.identity.group == 'free'"
    developer-tier:
      rates:
        - limit: 200000
          window: 1d
      when:
        - predicate: "auth.identity.group == 'developer'"
Users in the free tier are limited to 20 000 tokens per day; developer tier gets 200 000. The policy works against any OpenAI-compatible endpoint — including your Qwen3.6 InferenceService.
Models-as-a-Service (RHOAI 3.3)
OpenShift AI 3.3 ships Models-as-a-Service (MaaS) as a Technology Preview. MaaS adds a management layer on top of InferenceService objects:
| Capability | Description |
|---|---|
API Key management |
Users obtain per-project API keys through a self-service portal or CLI. Keys are scoped to specific models. |
Subscription tiers |
Platform Engineer defines tiers (free / developer / enterprise) with different token limits and request rates. |
Usage tracking |
MaaS records token consumption per API key. Available as a Prometheus metric: |
Chargeback |
Aggregate |
|
MaaS + |
Token Consumption PromQL
With MaaS or vLLM’s native metrics, you can track token usage per namespace:
# Total tokens generated per namespace over the last hour
sum by (namespace) (
  increase(vllm:generation_tokens_total[1h])
)
# Prompt tokens consumed (input cost driver)
sum by (namespace) (
increase(vllm:prompt_tokens_total[1h])
)Cost Model
With token metrics, a Platform Engineer can build a real cost model:
GPU instance  : g6e.xlarge (L40S) ~$1.65/hr (on-demand)
Token rate    : ~30 tokens/sec at moderate load
Cost/token    : $1.65 / 3600s / 30 tok = ~$0.000015 / token

Example workloads (per hour):
  Developer OpenCode session : ~50 000 tokens → ~$0.75
  Fortune Cookie app (100 rq): ~4 000 tokens  → ~$0.06
  10 concurrent developers   : ~500 000 tokens → ~$7.50
Reserved or Spot GPU instances on ROSA reduce these costs by 40-70%.
LLM Governance at Scale — Summary
| Capability | Mechanism |
|---|---|
Per-team token quotas |
|
Self-service API keys |
Models-as-a-Service (RHOAI 3.3 Tech Preview) |
Usage tracking |
|
Chargeback |
Prometheus → cost model → cloud billing integration |
Model versioning |
Multiple |
Audit trail |
OpenTelemetry tracing from app → LLM → vLLM logs (Tempo/Jaeger) |
✅ Module 400 Checkpoint
# GPU node is running and monitored
oc get node -l node.kubernetes.io/instance-type=g6e.xlarge

# InferenceService is still healthy
oc get inferenceservice -n llm-serving

# Fortune Cookie app is still serving
curl -s https://$(oc get route fortune-cookie -n fortune-cookie-dev \
-o jsonpath='{.spec.host}')/fortuneNAME STATUS ROLES AGE
ip-10-x-x-x.eu-west-1.compute.internal Ready worker 45m
NAME READY PREV LATEST AGE
qwen3 True 0 100 40m
Even the smallest deployment, monitored well, reveals the architecture of great systems.➡️ Move on to Conclusion & What’s Next.